
Post-match analyzes of statistics generally come down to a few basic values regarding the effectiveness of the serve, points won after the first or second serve and on return. The rubric most often quoted in the context of a given meeting are the numbers regarding breakpoints - those created and used.
However, these simplest and most general statistics throughout the entire match consist of points with different weights, taking into account the course of the match, the current result of individual games and the dynamics of emotions related to them. For this reason, it is worth from the set of all points played during the meeting, isolate those that are included in the Pressure Points set, i.e. free translation - points played under pressure. These are the points at which the server plays with the awareness of the imminence of losing the serve. This is, of course, about defending break points, mentioned earlier as a popular tool illustrating the course of the match, but also about the possibility of finding yourself in such a position only if you lose the next point.
There are eight scenarios in a game that can qualify as Pressure Points - 0-30, 15-30, 30-30, 0-40, 15-40, 30-40, 40-40 and 40-A.
The issue of points played under pressure is not so much psychological - though it is certainly an important factor of tennis craft - but it can be the subject of valuable analysis above all. It allows you to better understand the course of individual matches and to put the player's profile into a statistical framework, showing trends in the ability to avoid problems when passing your own pass, as well as the frequency of putting pressure on opponents. Pressure Points work on both sides - there are disproportions between players who are able to use their opponent's serve advantage more often and those who usually have more problems closing games where opportunities open up for them.
To prove the point of looking at Pressure Points as a useful area of statistics, it is worth citing some numerical comparisons consistent with general tennis truths. They concern, for example, the differences between the importance of the serve in women's and men's games, and between individual surfaces. The chart below shows the average number of Pressure Points per game played on own serve by top players competing in ATP tournaments and the best WTA players. The data concerns average values recorded over 52 weeks of the ranking period.
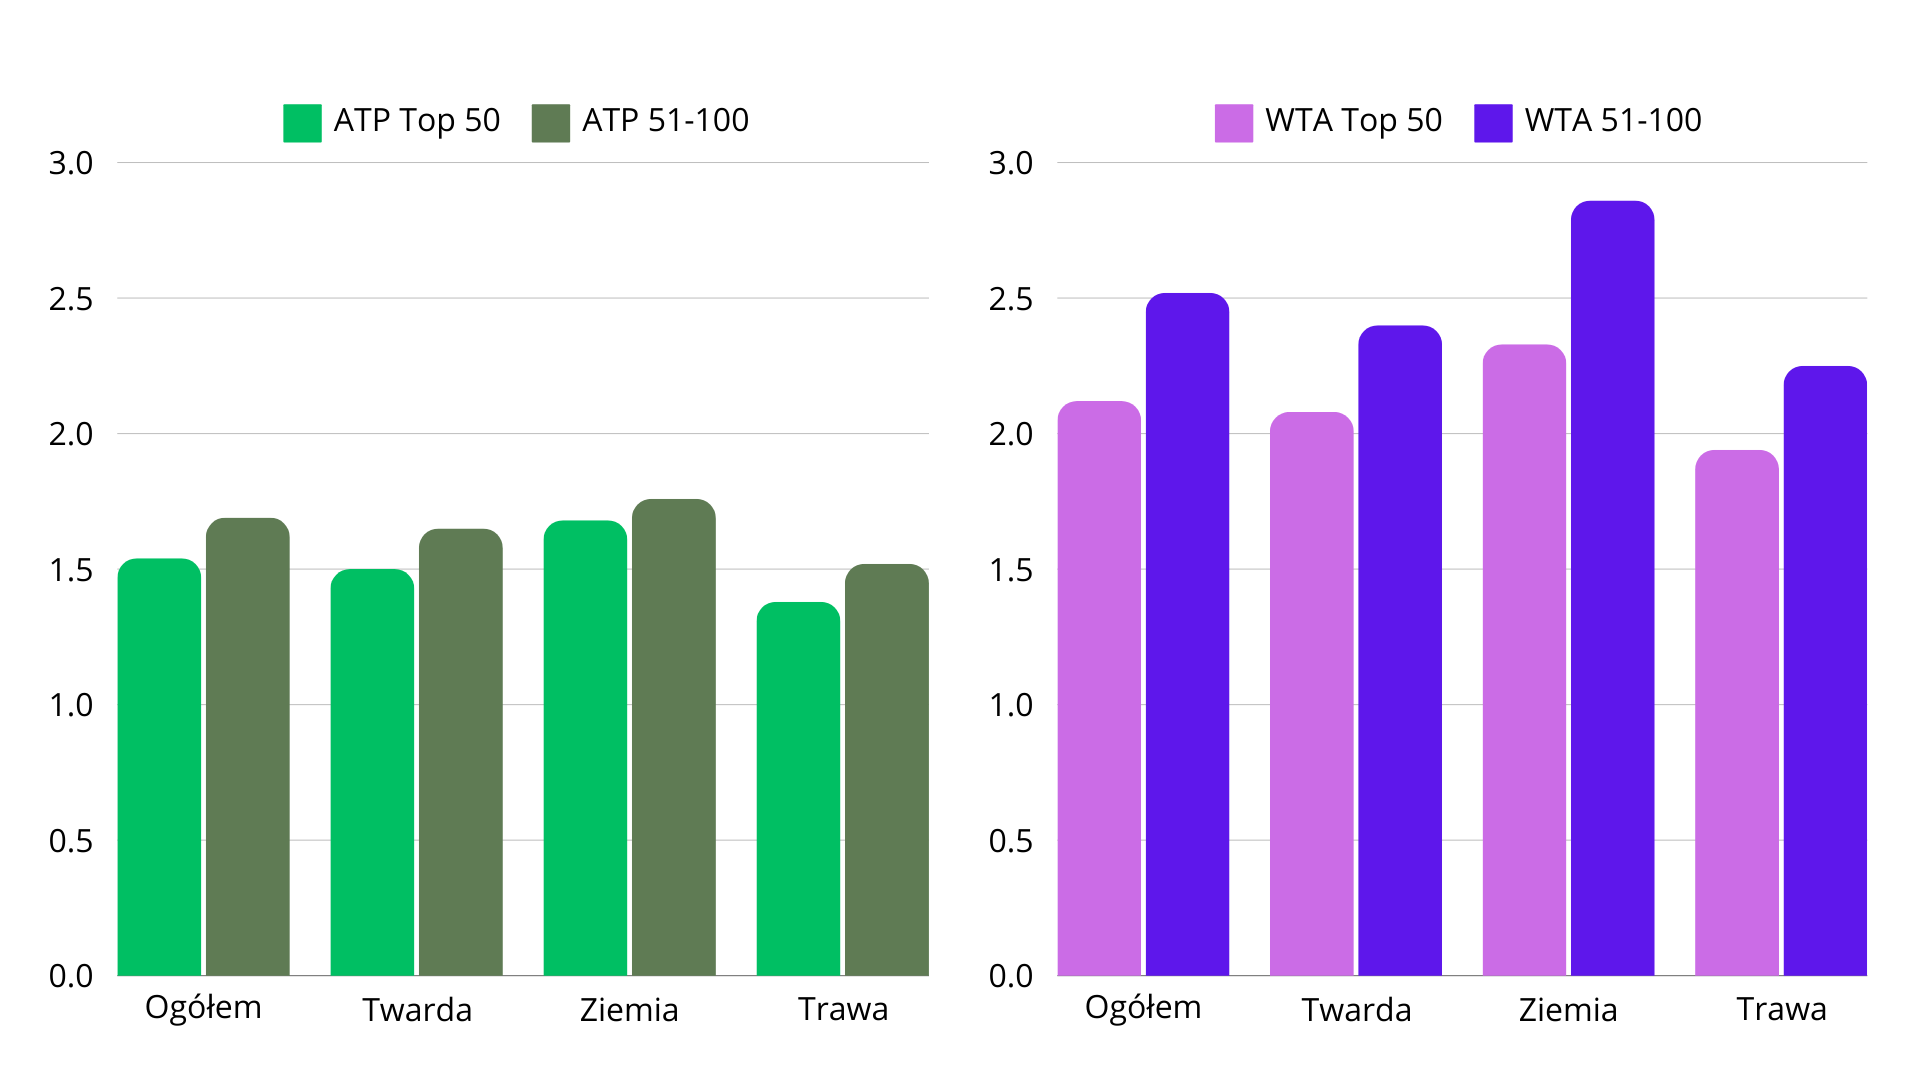
The most striking contrast is certainly the much higher service Pressure Points recorded in the women's tour. ATP tennis players play an average of 1.61 points per game counting towards the Pressure Points scenario, while WTA players play on average 2.31 points under pressure - that is, as much as 43.5% more.The list includes numbers for players from the top 100 ATP and WTA rankings. However, the chart shows two values in each column - the differences between players from the top 50 and those from the bottom half of the top 100. Another conclusion comes to mind here - the ATP rate is more equal in the context of Pressure Points. Of course, on each surface, players classified higher usually record better values, but the differences are not significant - the fluctuations do not exceed 10% in general terms, or reach only 4.8% on clay surfaces. This is due to the large number of players with a very strong serve, scattered around various regions of the top 100 rankings.
In the case of women, there are significant disproportions between the results of the first and second fifty on the world list. A conclusion can be drawn here about the great importance of Pressure Points and the ability to avoid pressure when serving yourself and creating it when serving your opponents, as important elements of building a competitive advantage. Players from places 51-100 in the ranking play under pressure on average 0.4 points per game more than the top 50, which is 18.9%.
The graph also confirms the well-known theory about the difference in service weight on individual surfaces. In both cycles, most Pressure Points are defended on the ground, the lowest values are generated by playing on grass, while the data collected is the closest to the year-round statistics from hard surfaces - mainly due to the large advantage of tournaments played on hard surfaces in the main cycle.
When is the easiest time to get out of trouble?
When talking about the impact of Pressure Points on the course of events in tennis matches, it is worth taking a look at in which scenarios players are most often able to defend their own serve and when they most often manage to break their opponents' serves. Of the eight point scenarios mentioned earlier, there are, of course, those from which it is more difficult to save your own service, as well as those where, statistically, it usually ends in success.
It's easy to imagine that getting back from 0-40 is a much more difficult task than defending a single break point or being better at taking advantage. This is well illustrated by charts with the average % of service games won from a specific state in each state of eight scenarios.
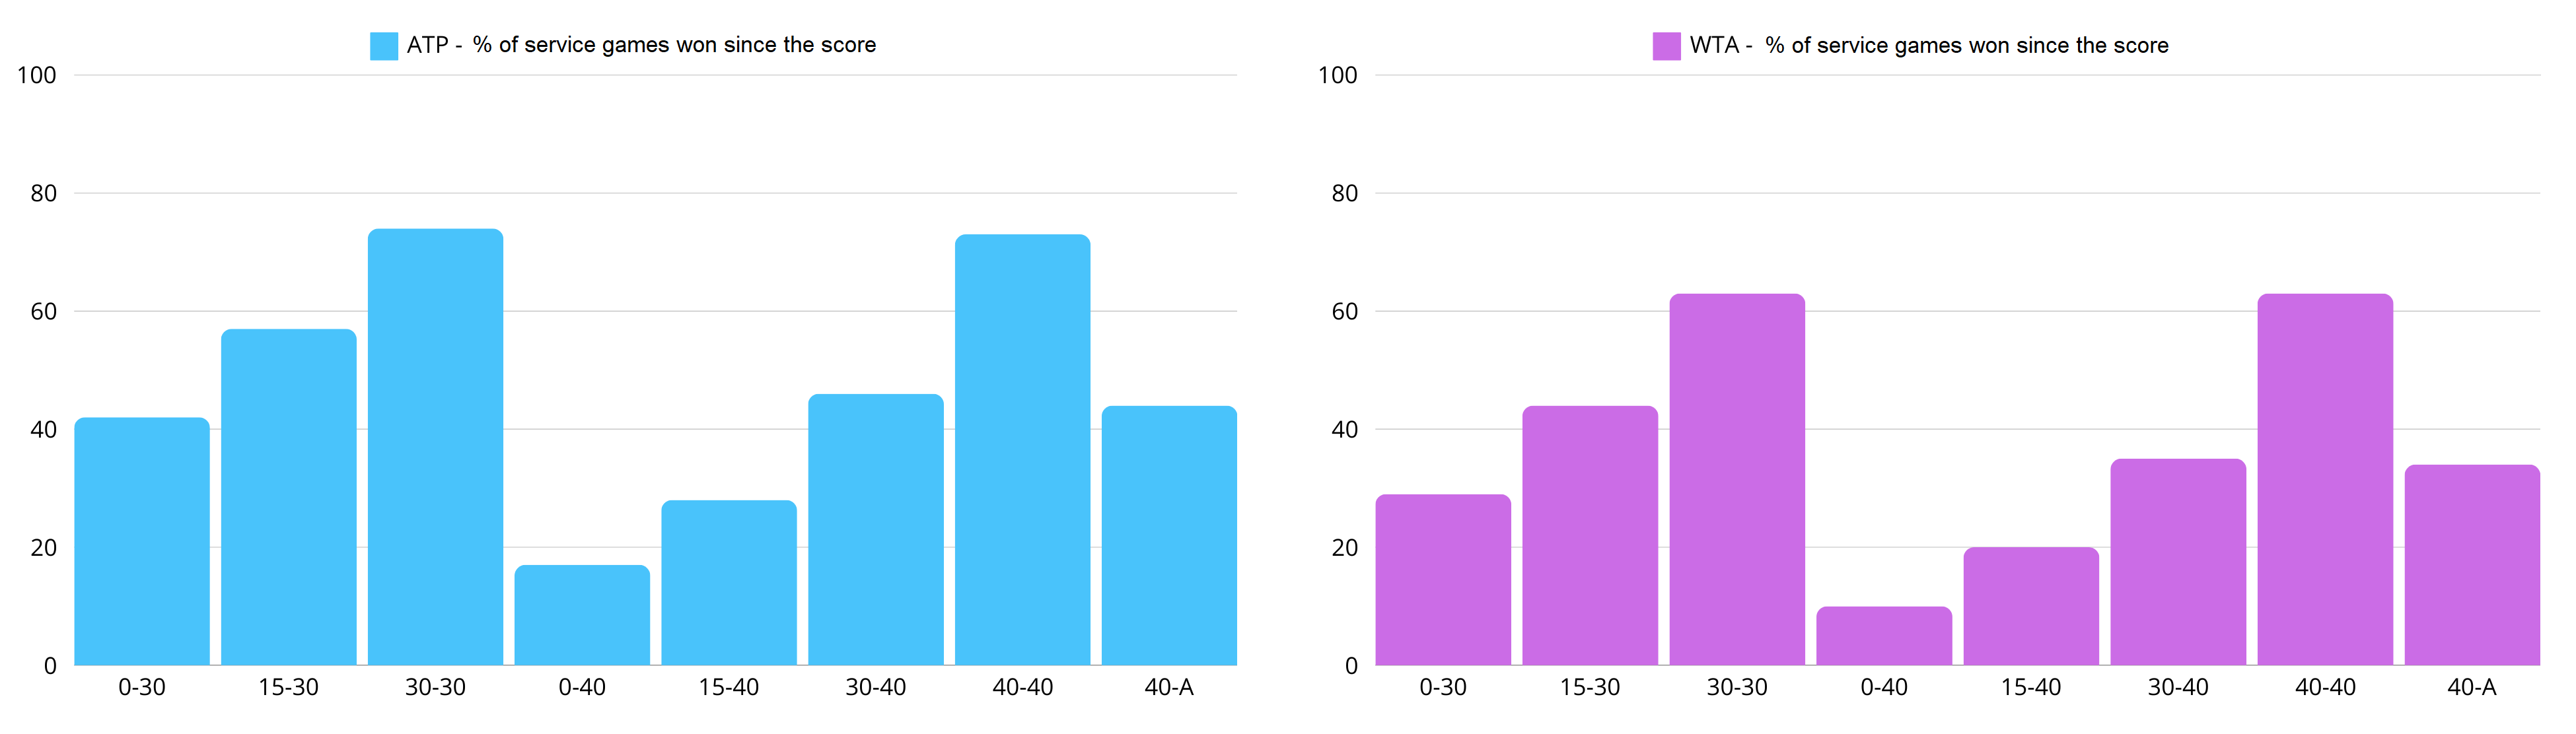
The set of data averaged over 52 weeks of competition in the ATP and WTA tournaments shows repeated patterns. The dynamics of both charts look almost identical. The only significant difference is the consistently lower percentage of game wins in women's competitions throughout each scenario. This is a kind of confirmation of the differences described earlier without breaking down Pressure Points into individual variants.
The most difficult thing is, of course, to defend your own pass when the score is 0-40. For men it is 17% effective, for women it is only 10%. The closer the score in a game, the chances increase, of course. Of all pressure scenarios, the most effective way is to emerge from a state of practical equilibrium. In ATP it is 74% effectiveness from a score of 30-30 and 73% from a score of 40-40. In the WTA competitions there is a tie between both scenarios, but the values are lower than for men - it is 63% for 30-30 and balance. The differences are usually around 10%. The biggest deviation is the need to go from 15-30. In this seemingly least crisis situation, men emerge victorious 57% of the time, while in women's competitions it is only 44%.
Female tennis players are more effective in attack
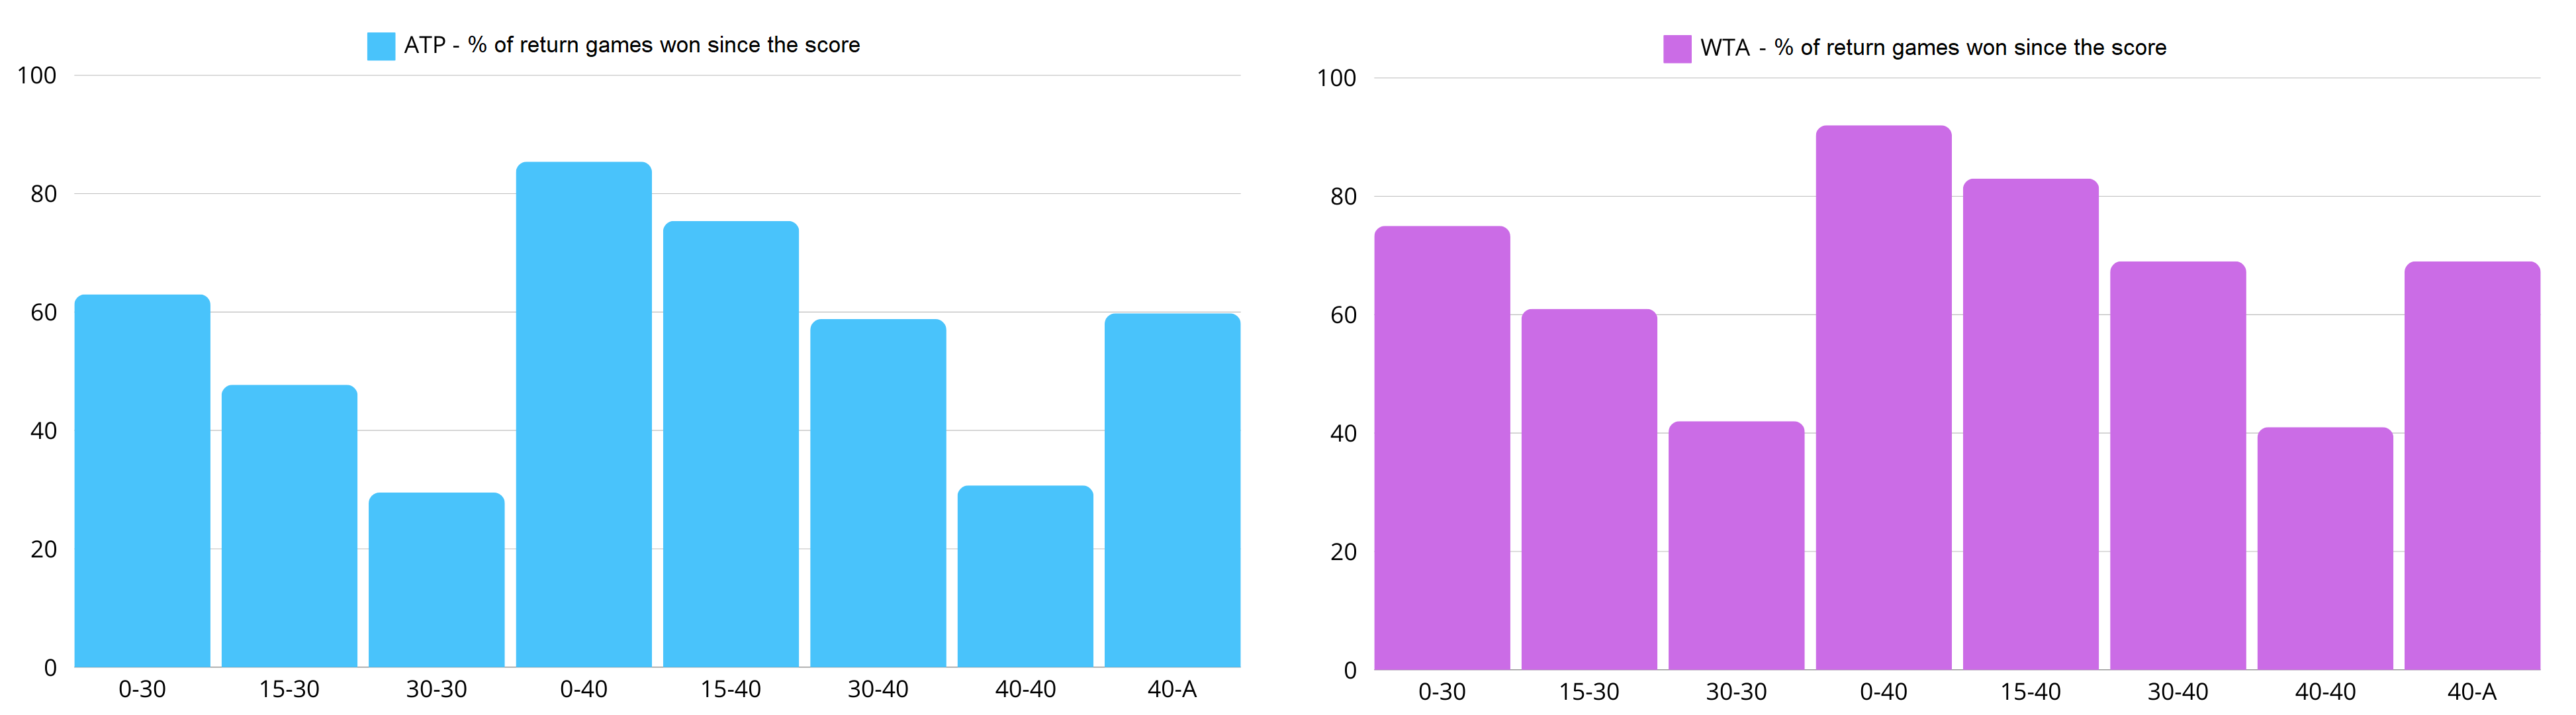
Pressure Points means not only the need to defend your own pass, but also the pressure of opportunities. The previous charts showed repeated dependencies on the serve, but it is worth looking at the issue from the other side, breaking down the same scenarios on the return. The dynamics here are also identical - the charts of the average values of the % of games won when received are almost a mirror image of the service. For this reason, the values from WTA games this time are higher in each of the scenarios by about 10%, similarly to the men's serve. Female players they usually win return games in 6 out of 8 scenarios, while ATP players only win in five. The variant that makes the difference is the result of 15-30 - the one that turns out to be a pain in the Ladies' serve, but is also a good opportunity to obtain breaks. Ladies win 61% of games from this state, while men win less than half - only 48%.
With a score of 0-40 in the women's competition, the impending break should almost be taken for granted. It happens in 92% of cases, while in ATP there is a little more room to avoid problems - a break occurs in 85.5% of games, which is also the highest value in the set.
Although the above analyzes deal with repeated dependencies, it is worth keeping in mind that these are speculations regarding the average results of a large group of players and over the entire calendar of top-ranking tournaments. Each match is a different story, and Pressure Point numbers often vary dramatically from match to match. In one-sided matches, numerical disproportions are visible primarily on both sides of the net.
We cordially invite everyone interested in this type of statistics to follow our analysis section, available on TennisRatio. Since the beginning of Roland Garros this year, the section has been enriched with the Pressure Points panel added to the profiles of all tennis players classified in the top 150 of the WTA and ATP rankings. In addition to general statistics and graphical visualizations regarding the dispositions of all players, it makes it possible to analyze the average Pressure Point values for each player, their effectiveness in playing under pressure and numerical data regarding critical scenarios in each match separately. Our database is updated daily, so we encourage you to follow our analyzes on an ongoing basis during many important tournaments in the coming months.