
Post-match statistical analysis often boils down to a few key metrics—serve efficiency, points won on first and second serves, and return performance. One of the most frequently cited statistics in match summaries is the number of breakpoints created and converted.
However, these general stats fail to account for the varying importance of individual points throughout a match. The weight of each point changes depending on the score, the dynamics of the game, and the pressure involved. That’s why it's valuable to isolate a specific subset of points - Pressure Points - which refer to moments when the server faces the immediate threat of losing their serve. This includes defending breakpoints, as well as situations where losing the next point would put them in a breakpoint scenario.
There are eight in-game scorelines that qualify as Pressure Points - 0-30, 15-30, 30-30, 0-40, 15-40, 30-40, 40-40 and 40-A.
While psychological resilience is undoubtedly a factor in handling Pressure Points, these moments can also be analyzed statistically to gain deeper insights into a player’s tendencies. Examining Pressure Points allows for a better understanding of individual matches, as well as a data-driven evaluation of a player’s ability to avoid trouble on serve and apply pressure on their opponents. Some players thrive in these situations, frequently capitalizing on their opponent’s vulnerabilities, while others struggle to convert opportunities when it matters most.
Pressure Points as a Key Statistical Insight
To illustrate the importance of Pressure Points, we can compare numerical data that aligns with broader trends in professional tennis—such as differences in serve dominance between the men’s and women’s games and variations across different court surfaces. The graph below presents the average number of Pressure Points per service game for top-ranked ATP and WTA players, based on data collected over a rolling 52-week period.
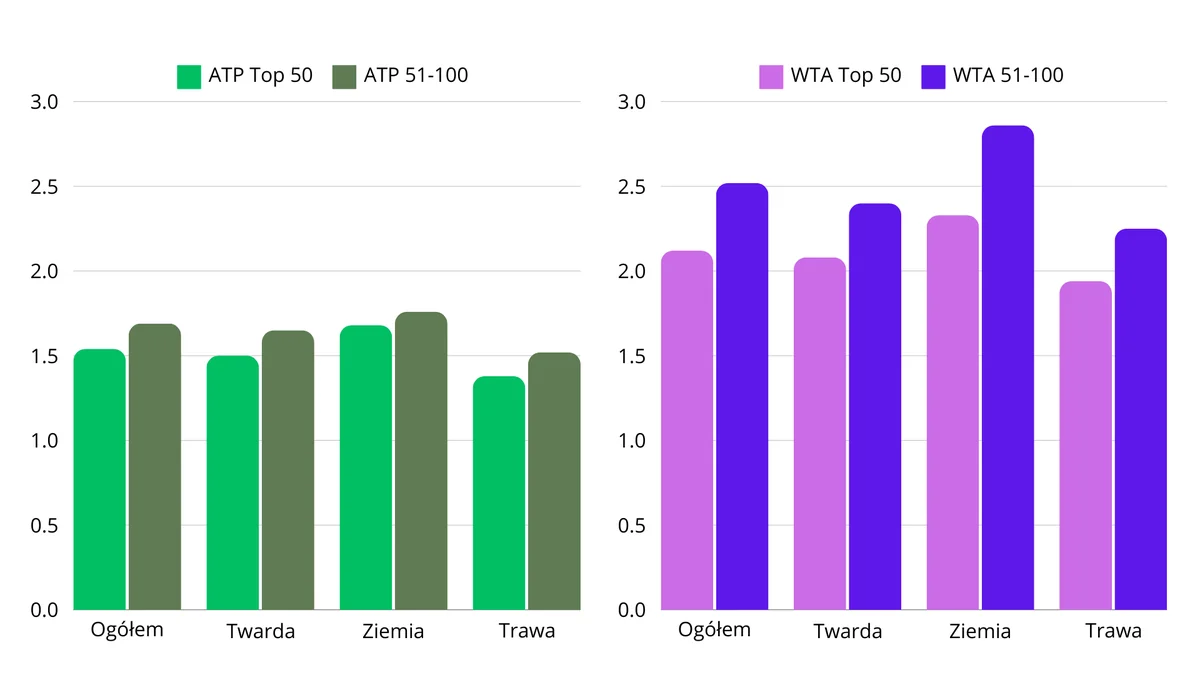
The most striking contrast is the significantly higher frequency of Pressure Points in women’s tennis. On average, ATP players experience 1.61 Pressure Points per service game, whereas WTA players encounter 2.31 per game - a 43.5% increase.
This dataset includes players ranked in the top 100 of both tours, but the chart differentiates between top 50 players and those ranked 51-100. One clear trend emerges: the ATP field is more balanced in terms of Pressure Points. While higher-ranked players generally perform better in these scenarios, the gap is relatively small - no greater than 10% overall and just 4.8% on clay courts. This reflects the ATP’s depth of strong servers across the rankings.
In contrast, there is a significant disparity between the top 50 and the second half of the WTA top 100. Players ranked 51-100 face 0.4 more Pressure Points per game than those in the top 50, an 18.9% difference. This underscores the importance of handling Pressure Points effectively—both in terms of avoiding pressure while serving and applying it when returning—as key components of building a competitive advantage.
The data also confirms well-established surface-related trends. Pressure Points occur most frequently on clay, while grass courts generate the lowest values. Meanwhile, hard courts yield statistics closest to the overall season average, given their dominance in the tournament calendar.
When is the easiest time to get out of trouble?
To assess the impact of Pressure Points on match outcomes, we can analyze the scenarios in which players are most and least likely to hold serve or break their opponent. Among the eight Pressure Point scenarios, some present greater challenges for servers, while others offer better chances of survival.
It's easy to imagine that getting back from 0-40 is a much more difficult task than defending a single break point or being better at taking advantage. This is well illustrated by charts with the average % of service games won from a specific state in each state of eight scenarios.
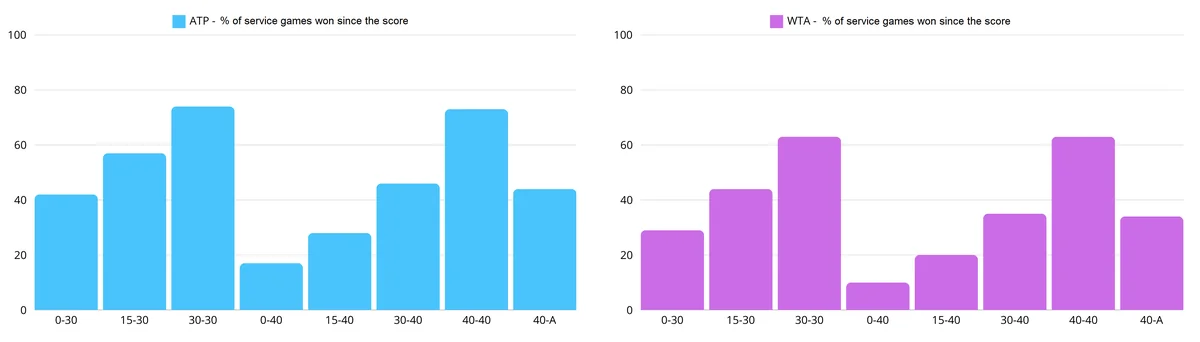
The set of data averaged over 52 weeks of competition in the ATP and WTA tournaments shows repeated patterns. The dynamics of both charts look almost identical. The only significant difference is the consistently lower percentage of game wins in women's competitions throughout each scenario. This is a kind of confirmation of the differences described earlier without breaking down Pressure Points into individual variants.
As expected, 0-40 is the toughest situation to recover from—ATP players hold serve only 17% of the time, while WTA players manage it just 10% of the time. Conversely, the highest hold rates occur in close-score situations. On the ATP Tour, players win their service games 74% of the time from 30-30 and 73% from deuce (40-40). In the WTA, both scenarios sit at 63%, reflecting the same trend but with slightly lower values.
Interestingly, one of the largest discrepancies occurs at 15-30. ATP players recover 57% of the time, while WTA players hold just 44%—a 13% difference.
WTA Players Are More Effective in Attack
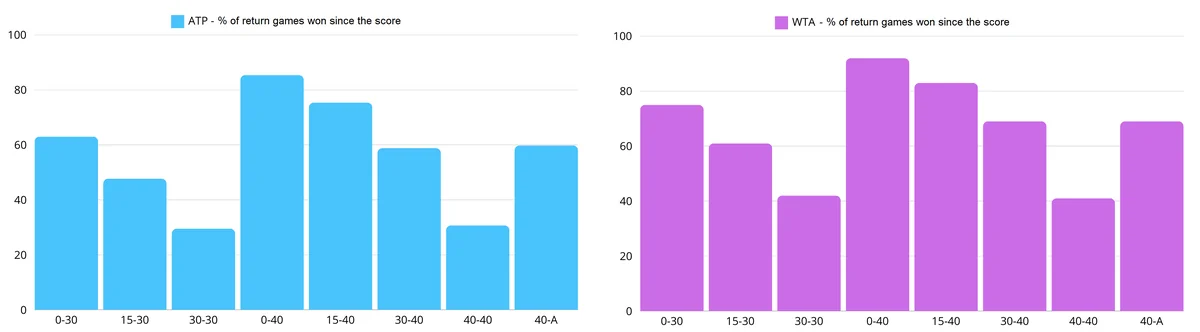
Pressure Points don’t just apply to serving under pressure - they also measure how well players capitalize on opportunities when returning. While the previous charts illustrated serve trends, analyzing the same eight scenarios from the returner's perspective reveals a near-mirror image of the service data.
In this case, WTA players have higher success rates across all Pressure Point scenarios - much like their lower hold rates on serve. Women break serve more often than men in six out of the eight scenarios, whereas ATP players typically win return games in only five. The key difference is the 15-30 scoreline - an area where WTA players excel. Women convert a break from 15-30 in 61% of cases, whereas ATP players break only 48% of the time.
At 0-40, WTA players are nearly guaranteed to gain a break, succeeding 92% of the time. Meanwhile, ATP players still allow some room for a comeback, with the break occurring in 85.5% of cases - though this remains the highest value in the dataset.
Beyond the Averages: Match-to-Match Variability
While these statistics reveal clear patterns, it's important to remember that they reflect aggregate data across an entire season. Every match is unique, and Pressure Point figures can vary dramatically based on the flow of play. In one-sided matches, for example, disparities in these numbers are often stark for both the server and the returner.
Track Pressure Point Data in Real-Time
For those interested in a deeper dive into these statistics, TennisRatio’s analysis section provides real-time Pressure Point data for ATP and WTA players ranked in the top 150. Since the start of Roland Garros this year, we have introduced a Pressure Points panel, which offers:
- Overall statistics and visualized trends for all players
- Individual Pressure Point averages for each player
- Success rates in pressure situations
- Breakdowns of critical in-match scenarios
Our database updates daily, allowing fans and analysts to track these numbers throughout the season. With many high-profile tournaments on the horizon, we invite you to explore how Pressure Points influence the biggest moments in the sport.